Reimagined ITOps is a weekly series about what IT operations becomes when AI stops assisting and starts operating. This is article 5 of Season 1. Stay with it.
Ask a head of IT operations where the estate sits on the maturity curve, and you get one number. Stage 2. Stage 3 on a confident day.
That number is an average, and an average is close to the least useful thing you can know about an IT estate.
Inside one enterprise, I will usually find password and access demand already handled without a human touching it, an endpoint estate sitting somewhere in the middle, and a legacy application tower where an engineer still reads the alert, decides, and types the command by hand.
Three different stages. One company. One score, describing none of them.
My claim: Maturity is a property of a tower and a class of demand, not a property of an enterprise. And the stage at the top of the model is considerably narrower than the version currently being sold.
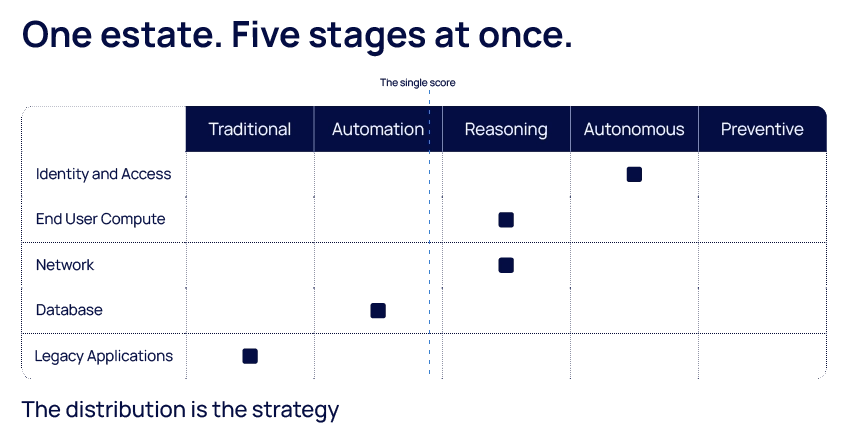
Fig 1: One estate, five stages at once.
Alt text: Dashboard-style maturity grid. Rows are IT towers: Identity and Access, End User Compute, Network, Database, Legacy Applications. Columns are the five stages: Traditional, Automation, Reasoning, Autonomous, and Preventive. One marker per row, scattered across different columns rather than aligned in a single line, with a dashed line marked the single score falling between the Automation and Reasoning columns. Title: one estate, five stages at once. Caption: The distribution is the strategy. Reimagined ITOps S01 A05.
A Single Score Is Not a Fundable Number
The enterprise-level maturity score fails for a plain reason: nobody can spend it.
“We are a level 2 organization” funds nothing, because it names no tower, no queue, no owner, and no next action. “Access and identity demand is running at governed execution, our database tower is still fully manual and closing that gap is worth this much in cost-to-serve” is a budget line.
Adjacent disciplines worked this out already. Security and data governance assessments now report per domain as standard practice, precisely because a single averaged number conceals the imbalance that matters.
IT operations kept the single score longer than anyone, and I think I know why. The single score is the number that fits on a board slide, and the per-tower picture is the one that starts an argument about which tower goes first.
That argument is the valuable part.
An Enterprise-wide Stage Target Produces an Enterprise-wide Pilot
Here is the cost of averaging. Set a stage target for the whole estate, and you will scope a program for the whole estate, and a program for the whole estate is the most reliable way to build a business case nobody can defend.
The market data on this is unkind. One major analyst firm expects more than 40% of agentic AI projects to be canceled by the end of 2027, citing escalating costs, unclear business value, and inadequate risk controls. Separately, industry research from 2025 puts the share of AI proofs of concept that never reach wide deployment at roughly 88%.
Read the cancellation reasons carefully. Model capability is not on the list. Those are scoping and governance failures, which is a more uncomfortable finding, because scoping is entirely within the buyer’s control.
A per-tower view fixes the scoping problem by forcing three questions before money moves. Which tower has the deepest context under it? Which classes of demand in that tower actually converge on the same resolution? What is the blast radius if an action there goes wrong?
Those answers are specific to a queue, which is the same discipline as assessing context depth per domain rather than declaring it estate-wide. You cannot average your way to either one.
What Each Stage Actually Buys
Five stages, and the honest version of each is shorter than the marketing version.
- Traditional Ops: humans triage, decide, and execute. It is the baseline for every other number, and it is alive in at least two towers of most estates that call themselves modern.
- Automation Ops: scripts remove repeatable task work; humans still decide. Coverage tops out around 30% to 40%, and the plateau is structural rather than a question of effort.
- Reasoning Ops: the system interprets signals and knowledge and produces evidence-backed next actions. Humans execute and validate. This is the trust-earning stage, and it is deliberately slow.
- Autonomous Ops: governed agents execute approved work, verify that the condition cleared, and roll back when verification fails. Humans govern.
- Preventive Ops: the demand does not arrive.
Notice what the first four have in common. Every one of them resolves demand faster. Only the fifth removes it. That is the whole argument of this series compressed into one paragraph, and it is why the stages are not interchangeable rungs of the same ladder.
Preempt the Predictable. Not Predict Everything.
The apex stage is where I part company with most of the market, and where I have to give something up.
Prediction language is now standard in operations marketing. Anticipate issues before they cause outages. Predict failures before they happen. Prevent downtime. Stated without a scope, those claims are not falsifiable, which means they are not commitments.
So here is our scope, stated narrowly on purpose. Capacity exhaustion. Certificate expiry. Patch-driven regressions. Configuration drift. Known degradation curves. Failures that carry a signature, a lead time, or, in some cases, a published expiry date.
We do not claim to predict novel failure. Nobody can, and an operator who has run a real bridge call knows it within a paragraph.
The narrow version is not a small prize. Research published in 2025 found that more than 70% of organizations had at least one certificate-related outage in the preceding year, with recovery typically taking hours. One of the largest cloud outages of this year traced back to a certificate that nobody renewed.
An expiry date is the most predictable event in enterprise technology. We still treat it as a surprise, at scale, every year.
That is the honest shape of Preventive Ops. Not clairvoyance. The industrialization of the failures that already told you they were coming.
What This Changes
First, replace the maturity slide with a grid. Towers down one side, stages across the top, one honest mark per row. The distribution is the strategy.
Second, fund towers, not programs. The cost case for closing a gap in one tower is calculable. The cost case for moving an enterprise up a stage is a wish.
Third, give every prediction an owner before you buy the prediction. A forecast with no automated preventive action and no accountable name against it is just a more anxious dashboard, and it will be ignored within two quarters.
The Question for IT Leaders
Take your current maturity number and try to spend it. Name the tower, the queue it improves, and the person accountable. If you cannot, the number describes your slide rather than your estate.
So, my question: if you scored your towers separately this quarter, how far apart would the best and the worst turn out to be?
Next week: what happens when the end user becomes the first resolver, and the service desk stops being the first place work arrives.
Sanjesh Rao leads product strategy and innovation for Hexaware’s Agentic ITOps platform.